Sunday, April 11, 2010

Activity 8: 3D Surface Reconstruction fron Structured Light


Three-dimensional (3D) imaging can be performed on an object with various methods. One can rotate the object and image the rotation or just image the object and rotate the camera. However, there are some instances that the object or camera rotation is impossible to perform. An alternative is by projecting grid illuminations on the object. It is observed that distortions on the grids appear whenever a flat surface is encountered. An example of this is shown in Figure 1 where various gray code patterns are projected on a pyramid.


Figure 1. Upper images: Gray grid patterns projected on a flat surface. Bottom images: Gray grid patterns projected on a pyramid.

The 3D image of the pyramid is generated from the bit plane stack (BPS). The BPS is just the sum of the gray patterns that are each multiplied by its bit weight. The bit weights for the seven grid patterns are from 2^0 to 2^6. The BPS of the flat surface and the pyramid are shown in Figures 2 and 3.

Figure 2. BPS of the flat surface.

Figure 3. BPS of the pyramid.


The 3D image is formed from the two BPS by obtaining the displacement of the stripes. The displacement is the actual height of the object. The 3D image of the pyramid is shown in Figures 4 and 5.

Figure 4. Sample 3D image of the pyramid.

Figure 5. Second sample 3D image of the pyramid shown at a different angle.

There are noise from the 3D image so filtering methods must be added to the 3D reconstruction process.

I give myself a grade of 10 for this activity.

I would like to acknowledge Thirdy for lending me the images of the grid patterns for the flat surface and the pyramid.

Reference:

[1] J.Guhring, "Dense 3D surface acquisition by structured-light using off-the-shelf components,".

Friday, April 9, 2010

Activity 5: Camera Calibration


Camera calibration is performed to determine image coordinates from the real world coordinates. There are two methods that can be used for camera calibration: (A) folded checkerboard and (B) camera calibration toolbox.

A. Using a Folded Checkerboard

An image of the folded checkerboard is shown in Figure 1 with the convention of the x, y, and z axes.

Figure 1. Folded checkerboard with axes convention.

25 Points are chosen from the folded checkerboard as shown in Figure 2. The selected points are some corners of the checkers from the folded checkerboard.

Figure 1. Selected 25 points in the folded checkerboard.

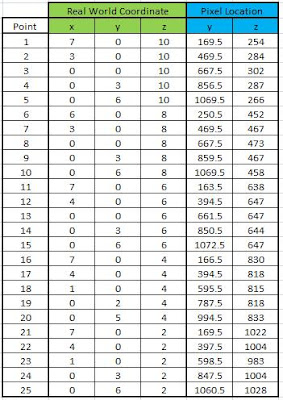
The real world and image coordinates of the chose points are given in Table I. The image coordinates are obtained via the ginput function of Matlab 7.

Table I. Real world and image coordinates of the 25 Points.
The camera parameters a are obtained from the real world and image coordinates using Equation 33 of Ref. 1. The predicted image coordinates using the camera parameters a are obtained using Equations 29 and 30 of Ref. 1. The predicted image coordinates are shown in Figure 2.

Figure 2. Predicted new image coordinates using the camera parameters.

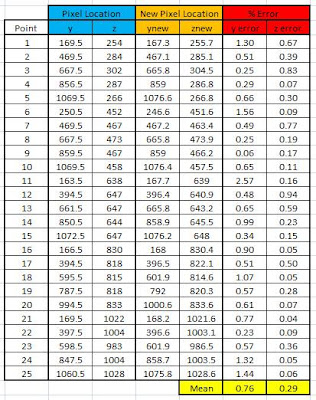
A comparison of the manually obtained and predicted image coordinates is given in Table II. It is observed that the mean errors for the y and z are 0.76 and 0.29, respectively. The small error indicates that camera calibration technique performs properly.

Table II. Comparison of the manually obtained and predicted image coordinates.
The camera calibration is again tested finding all the point in the z axis. The predicted image coordinates using the camera parameters are shown in Figure 3.

Figure 3. Predicted image coordinates found in the z axis.

B. Using the Camera Calibration Toolbox

Another method for camera calibration is through a toolbox developed for Matlab. The toolbox can be downloaded from Ref. 2. 20 images of a checkerboard with various translations and rotations are needed for this method. The 20 images are shown in Figure 4.


Figure 4. Images of a checkerboard under various translations and rotations.

Using the toolbox, the Matlab GUI will ask to point the edges of the checkerboard. The image with the chosen edges of the checkerboard is shown in Figure 5.

Figure 5. Selected edges of the checkerboard.

After selecting the edges of checkerboard, the toolbox will ask the user to confirm whether the corners of the checkerboard are all detected. The predicted corners of the checkerboard are shown in Figure 6 for some of the translations and rotations.


Figure 6. Predicted corners of the checkerboard for some translations and rotations.

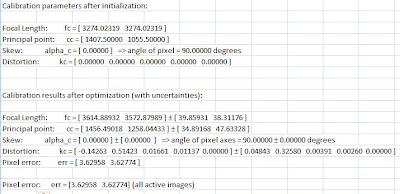
The intrinsic parameters such as the focal length, skew, etc. are outputs of the toolbox. The intrinsic parameters are given in Table III.

Table III. Intrinsic parameters.

The extrinsic parameters such as the translations and rotations of the checkerboard with respect to a camera location (camera-centered) are shown in Figure 7.

Figure 7. Checkerboard translations and rotations with respected to a camera location.

The extrinsic parameters such as the camera locations with respect of the checkerboard position (checkerboard-centered) are shown in Figure 8.

Figure 8. Camera locations with respect to a checkerboard position.

I give myself a grade of 10 for this activity.

References:

[1] M. Soriano, A Geometric Model for 3D Imaging, 2009.

[2] http://www.vision.caltech.edu/bouguetj/calib_doc.

Tuesday, March 16, 2010

Activity 4: High Dynamic Range Imaging


This research has been accepted for publication in IEEE Transactions on Plasma Science. Publication date is on November 2011.

Digitized photographs lack the dynamic range of intensity values. So some parts of the photographs are not seen because it may be underexposed or overexposed. High dynamic range (HDR) imaging is used to combine in an image its low and high intensity values. Debevec and Malik has used image processing to develop HDR images from a set of low dynamic range (LDR) images with varying shutter speeds [1]. In this report, the method of Debevec and Malik is used to obtain a HDR image of a magnetized argon sheet plasma.

Several plasma images as shown in Figure 1 are taken under various exposure values (EV) using an Olympus FE-19 camera. All the images are taken at same stop of f/2.8. The shutter speeds of the images are determined from the properties of each image.

Figure 1. Argon plasma images taken at various shutter speeds: (a) 1/200, (b) 1/160, (c) 1/125, (d) 1/100, (e) 1/80, (f) 1/60, (g) 1/50, (h) 1/40, (i) 1/30, (j) 1/5, and (k) 1/2 s. [3]

The response functions of all the color channels are determined using the Matlab code of Debevec and Malik [1]. For a detailed discussion about the process of obtaining HDR images, see Ref. 1. The response functions are shown in Figure 2.

Figure 2. Response functions of all channels for an Olympus FE-19 camera.

The radiance maps of each channel are then obtained from the response functions. The radiance maps are shown in Figure 3. A jet colormap is used to represent the intensity values of the radiance maps.

Figure 3. Jet false color images of radiance maps of all channels: (a) red, (b) green, and (c) blue. [3]

Each radiance map has different scales. Linear tone mapping is used to make a composite image of the radiance maps. The linear tone mapped HDR image is shown in Figure 4. It is observed that the sheet plasma is actually tapered with its peak intensity near the anode.

Figure 4. Linear tone mapped HDR image.

The LDR and HDR images of the sheet plasma are shown in Figure 5. It is seen that the HDR image has a broad range of intensities compared with the LDR images. As the shutter speed is increased, the LDR image becomes saturated and the sheet plasma spreads out. Thus, the saturated LDR image may give rise to false information about the real size of the sheet plasma.

Figure 5. Upper part: LDR and HDR images. Lower part: Contrast stretched images.

By comparing the histograms of the LDR and HDR images as shown in Figure 6, it is observed that the HDR image has a broad range of pixel values compared with LDR images. For the underexposed LDR images, the high intensity values are missing. On the other hand, for the overexposed LDR image, the low intensity values are the ones missing.

Figure 6. Histogram of LDR and HDR images. [3]

I give myself a grade of 10 for this activity.

References:

[1] P. Devebec and J. Malik, “Recovering High Dynamic Range Radiance Maps from Photographs,” SIGGRAPH’97.

[2] M. Soriano, "Activity 4: High Dynamic Range Imaging," 2009.

[3] L.M. Rosario et al., "High Dynamic Range Imaging of Magnetized Sheet Plasma," IEEE Transactions on Plasma Science (to be published).

Activity 3: Silhouette Processing


Image processing of body outlines or silhouettes has been used in a lot of researches of biometrics using pattern movement of limbs or gait. Soriano et al. has used silhouette processing for the determination of curve spreads as a biometric for front-view gait for an individual [1]. In their study, they have demonstrated that features of the silhouettes such as concavities can be used to identify body parts. The time variations of the moving body outline are used to obtain the curve spreads specific to the individual. In this report, silhouette processing is demonstrated by determining the concavities of a chosen static image.

The image to be used is a picture of the oblation statue as shown in Figure 1. Morphological operations are implemented to determine the outline of the image. Image processing is performed in Matlab 7.

Figure 1. Original Image.

First, the image is converted to grayscale using rgb2gray function. The grayscale image is shown in Figure 2.

Figure 2. Grayscale Image.

Next, the grayscale image is binarized using a global thresholding via graythresh function. The binary image is shown in Figure 3.

Figure 3. Binary Image.

Only the outline of the image is need so the binary image is cleaned using imclose function. The cleaned image is shown in Figure 4.

Figure 4. Cleaned Image.

The outline of the cleaned image is determined using the edge function. The outline of the cleaned image is shown in Figure 5.

Figure 5. Edge detected Image.

The pixel locations of the edges are obtained with the bwboundaries function. The PixelList function of regionprops is not recommended for this task because the output pixel locations of this function do not follow the boundary. The plotted pixel locations of the outline are shown in Figure 6.

Figure 6. Plotted Outline of the Original Image.

A freeman vector is determined from pixel locations. The difference of two adjacent pixels is obtained from the freeman vector. The G value is a running sum of three adjacent difference. The G values represent the concavities. For a detailed discussion on the above process, see Reference 1. The plotted outline of the image overlayed with G values is shown in Figure 7.

Figure 7. Plotted image outline overlayed with G values.

The G values of the neck part of the oblation image are zoomed in and shown in the inset of Figure 8. It can be observed that flat regions have G values of zero. It is also observed that concave and convex regions have positive and negative G values, respectively.

Figure 8. Neck part with G values.

I give myself a grade of 10 for this activity.

References:

[1] M. Soriano et al., "Curve spreads - a biometric from front-view gait video," Patten Recognition Letters 25, 1595-1602 (2004).

[2] M. Soriano, "A - Silhoutte Processing," 2009.

Activity 2: Hough Transform


The Hough transform is a feature extraction methods used in image analysis to find arbitrary shapes such as lines, circles, ellipses, etc. In this report, Hough transform is implemented in Matlab 7 and is used to fine lines in the image shown in Figure 1.


Figure 1. Original Image.

The original image is converted to graycale (see Figure 2).

Figure 2. Grayscale Image.

The edge function is the used to determine the outline of the grayscale image (see Figure 3).

Figure 3. Edge Detected Image.

The hough function is performed to determine the accumulator matrix of r and θ (see Figure 4). The equations of lines are determined from peaks of the accumulator matrix (white circles in Figure 4).

Figure 4. Hough Transform.

An overlay of the lines and the original image is shown in Figure 5.

Figure 5. Original Image with found Lines (colored blue).

I give myself a grade of 10 for this activity.

Reference:

[1] M. Soriano, "A - Hough Transform," 2009.